Overview
How much of your time do you spend writing code? How much of your time you spend fixing code? Which would you rather be doing? This is a no-brainer, right? As you set out to develop a game, having a strategy for how you are going to illuminate the "huh?" moments well before you are on the 15th level is going to pay dividends early and often in the product life cycle. This article discusses strategies and lessons learned from debugging the test level for the 2D top down shooter, Star Crossing.
Intrinsic Tools
Before discussing the tools you do not have by default, it seems prudent to list out the ones you will generally have available in most modern development tool chains.
- Console output via printf(...). With more advanced loggers built into your code base, you can generate oceans worth of output or a gentle trickle of nuanced information as needed. Or you can just have it print "here 1", "here 2", etc. To get output, you have to actually put in code just for the purpose of outputting it. This usually starts with some basic outputs for things you know are going to be helpful, then degenerates into 10x the number of logging messages for specific issues you are working on.
- Your actual "debugger", which allows you to set breakpoints, inspect variables, and gnash your teeth at when you try to have it display the contents of a std::map. This is your first line of defense and probably the one you learned to use in your crib.
- A "profiler" which allows you to pinpoint where your code is sucking down the frame rate. You usually only break this out (1) when things go really wrong with your frame rate, (2) when you are looking for that memory leak that is crashing your platform, or (3) when your boss tells you to run before shipping even though the frame rate is good and the memory appears stable, because you don't really know if the memory is stable until you check.
All these tools are part of the total package you start out with (usually). They will carry you well through a large part of the development, but will start to lose their luster when you are debugging AI, physics, etc. That is to say, when you are looking at stuff that is going on in real time, it is often very hard to put the break point at the right place in the code or pull useful information from the deluge of console output.
Random Thoughts
If your game has randomness built into it (e.g. random damage, timeouts, etc.), you may run into serious trouble duplicating failure modes. Someone may even debate whether the randomness is adding value to your game because of the headaches associated with debugging it. As part of the overall design, a decision was made early on to enable not-so-random-randomness as follows:
- A "cycle clock" was constructed. This is lowest "tick" of execution of the AI/Physics of the game.
- The cycle clock was set to 0 at the start of every level, and proceeded up from there. There is, of course, the possibility that the game may be left running forever and overflow the clock. Levels are time limited, so this is not a concern here (consider yourself caveated).
- A simple static class provided the API for random number generation and setting the seed of the generator. This allowed us to put anything we want inside of the generation so the "clients" did not know or care what the actual "rand" function was.
- At the start of every tick, the tick value was used to initialize the seed for the random number system.
This allowed completely predictable random number generation for the purposes of debugging. This also has an added benefit, if it stays in the game, of the game evolving in a predictable way, at least at the start of a level. Once the user generates their own "random input", all bets are off.
Pause, Validate, Continue
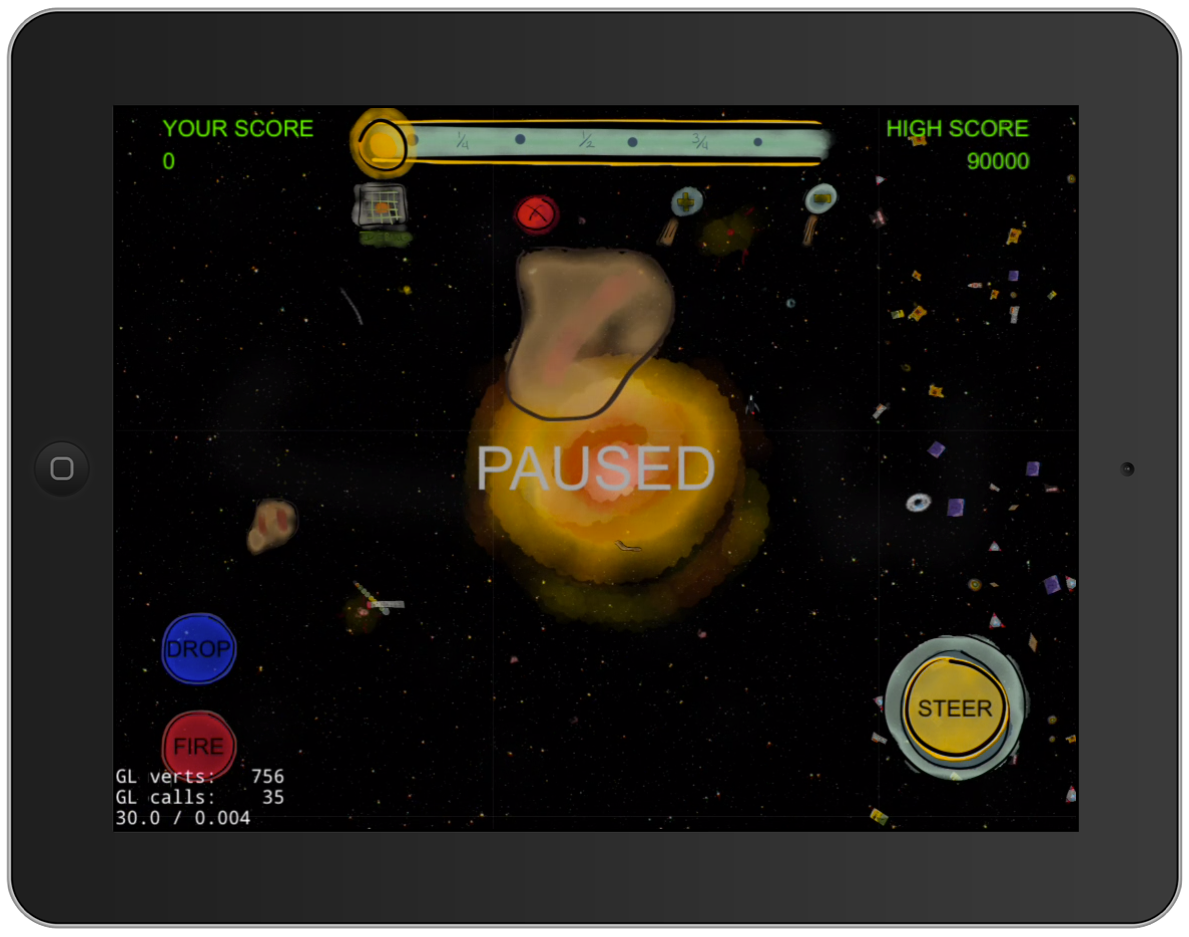
The screenshot below shows a scene from the game with only the minimal debugging information displayed, the frame rate.
The first really big problem with debugging a real-time game is that, well, it is going on in real-time. In the time it takes you to take your hand off the controls and hit the pause button (if you have a pause button), the thing you are looking at could have moved on.
To counter this, Star Crossing has a special (configurable) play mode where taking your finger off the "Steer" control pauses the game immediately. When the game is paused, you can drag the screen around in any direction, zoom in/out with relative impunity, and focus in on the specific region of interest without the game moving on past you. You could even set a breakpoint (after the game is paused) in the debugger to dig deeper or look at the console output. Which is preferable to watching it stream by.
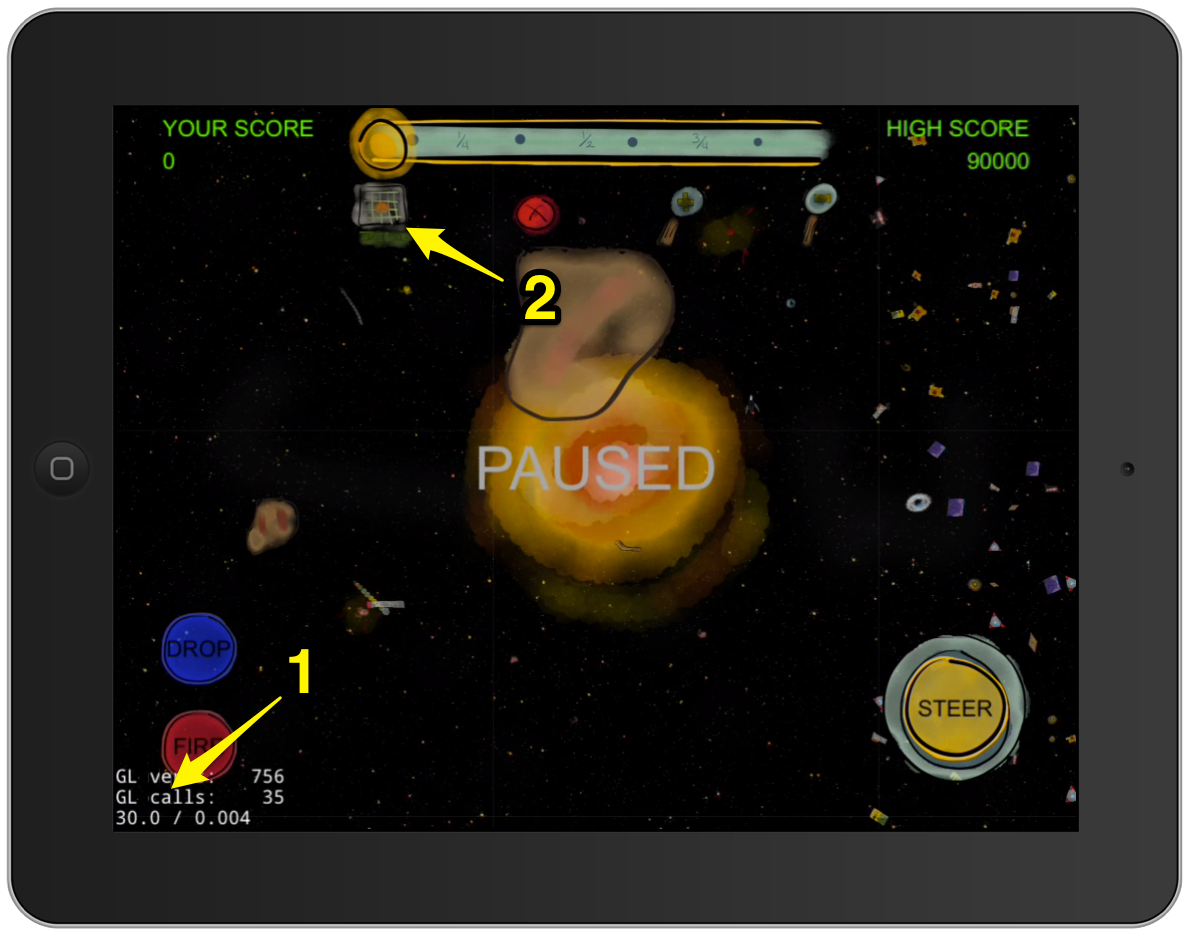
A further enhancement of this would be to add a "do 1 tick" button while the game was paused. While this may not generate much motion on screen, it would allow seeing the console output generated from that one cycle. The frame rate (1) is ALWAYS displayed in debug builds even when not explicitly debugging. It might be easy to miss a small slowdown if you don't have the number on the screen. But even a small drop means that you have exhausted the available time in several frames (multiple CPU "spikes" in a row) so it needs attention.
The visual debugging information can be turned on/off by a simple toggle (2). So you can leave it on, turn it on for a quick look and turn it off, etc. When it is on, it dropped the frame rate so it usually stayed off unless something specific was being looked at. On the positive side, this had the effect of slowing down the game a bit during on-screen debugging, which allowed seeing more details. Of course, this effect could be achieved by slowing down the main loop update.
Debug Level 1
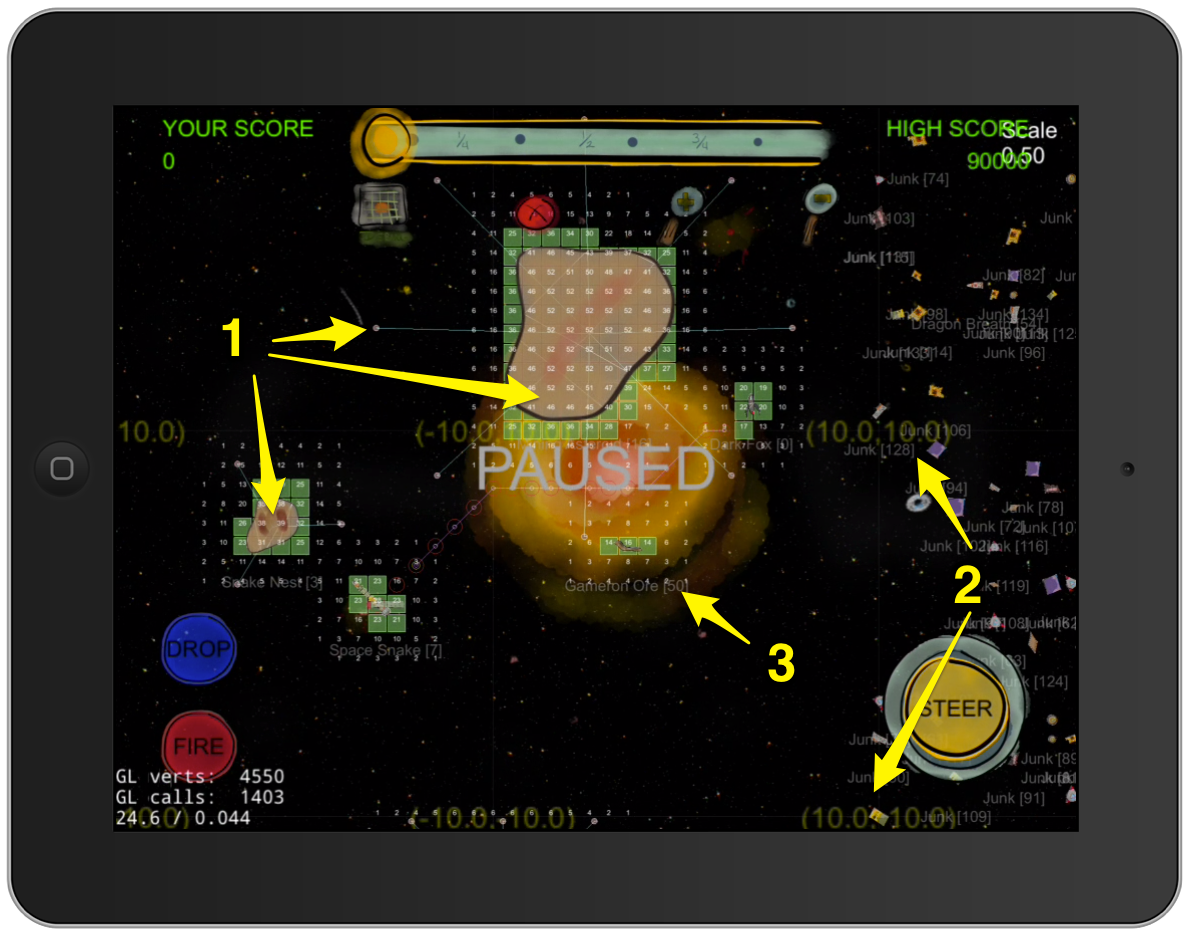
The screen shot below shows the visual debugging turned on.
Physics
At the heart of the game is a physics engine (Box2D). Every element in the game has a physical interaction with the other elements. Once you start using the physics, you must have the ability to see the bodies it generates. Your graphics are going to be on the screen but there are physics elements (anchor points, hidden bodies, joints, etc.) that you need to also see.
The Box2D engine itself has a capacity to display the physics information (joints, bodies, AABB, etc.). It had to be slightly modified to work in with Star Crossing's zooming system and also to make the bodies mostly transparent (1). The physics layer was placed low in the layer stack (and it could be turned on/off by header include options). With the graphics layer(s) above the physics, the alignment of the sprites with the bodies they represented was easy to check. It was also easy to see where joints were connected, how they were pulling, etc.
Location
Star Crossing is laid out on a floating point "grid". The position in the physics world of all the bodies is used extensively in console debug output (and can be displayed in the labels under entities...more on this later). When levels are built, a rough "plan" of where items are placed is drawn up using this grid. When the debug information is turned on, major grid locations (2) are displayed. This has the following benefits:
- If something looks like it is cramped or too spaced out, you can "eye ball" guess the distance from the major grid points and quickly change the positions in the level information.
- The information you see on screen lines up with the position information displayed in the console.
- Understanding the action of distance based effects is easier because you have a visual sense of the distance as seen from the entity.
Entity Labels
Every "thing" in the game has a unique identifier, simply called "ID". This value is displayed, along with the "type" of the entity, below it.
- Since there are multiple instances of many entities, having the ID helps when comparing data to the console.
- The labels are also present during the regular game, but only show up when the game is paused. This allows the player to get a bit more information about the "thing" on the screen without an extensive "what is this" page.
- The labels can be easily augmented to display other information (state, position, health, etc.).
- The labels scale in size based on zooming level. This helps eye-strain a lot when you zoom out or in.
Debug Level 2
While the player is able to move to any position (that the physics will allow), AI driven entities in the game use a combination of steering behaviors and navigation graphs to traverse the Star Crossing world.
Navigation Grid
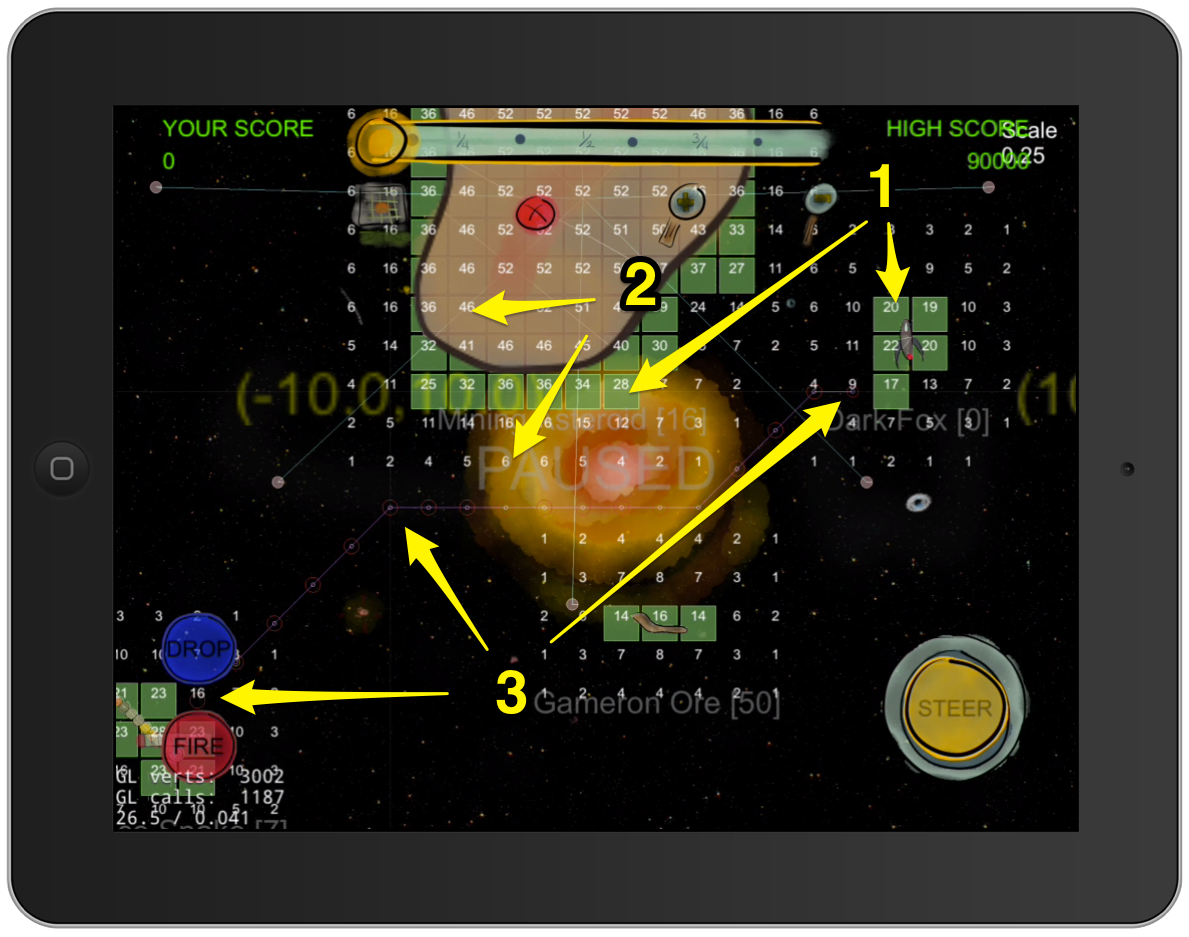
The "navigation grid" (1) is a combination of Box2D bodies laid out on a grid as well as a graph with each body as a node and edges connecting adjacent bodies. The grid bodies are used for collision detection, dynamically updating the graph to mark nodes as "blocked' or "not blocked". The navigation grid is not always displayed (it can be disabled...it eats up cycles). When it is displayed, it shows exactly which cells an entity is occupying. This is very helpful for the following:
- Watching the navigation path generation and ensuring it is going AROUND blocked nodes.
- The path following behavior does a "look ahead" to see if the NEXT path edge (node) is blocked before entering (and recomputes a path if it is). This took a lot of tweaking to get right and having the blocked/unblocked status displayed, along with some "whiskers" from the entity really helped.
Navigation Grid Numbers
Each navigation grid node has a label that it can display (2). These numbers were put to use as follows:
- Verifying the path the AI is going on matches up with the grid by displaying the navigation graph index of the grid node. For example, an AI that must perform a "ranged attack" does this by locating an empty node a certain distance from the target (outside its physical body), navigating to that node, pointing towards the target, and shooting. At one point, the grid was a little "off" and the attack position was inside the body of the target, but only in certain cases. The "what heck is that" moment occurred when it was observed that the last path node was inside the body of the target on the screen.
- Star Crossing uses an influence mapping based approach to steer between objects. When a node becomes blocked or unblocked, the influence of all blockers in and around that node are updated. The path search uses this information to steer "between" blocking objects (these are the numbers in the image displayed). It is REALLY HARD to know if this working properly without seeing the paths and the influence numbers at the same time.
Navigation Paths
It is very difficult to debug a navigation system without looking at the paths that are coming from it (3). In the case of the paths from Star Crossing, only the last entity doing a search is displayed (to save CPU cycles). The "empty" red circle at the start of the path is the current target the entity is moving toward. As it removes nodes from its path, the current circle "disappears" and the next circle is left "open".
One of the reasons for going to influence based navigation was because of entities getting "stuck" going around corners. Quite often, a path around an object with a rectangular shape was "hugging" its perimeter, then going diagonally to hug the next perimeter segment. The diagonal move had the entity pushing into the rectangular corner of the object it was going around. While the influence based approach solved this, it took a while to "see" why the entity was giving up and re-pathing after trying to burrow into the building.
Parting Thoughts
While there were a lot of very specific problems worked, the methods used to debug them, beyond the "intrinsic tools" are not terribly complex:
- You need a way to measure your FPS. This is included directly in many frameworks or is one of the first examples they give when teaching you how to use the framework.
- You need a way to enable/disable the debug data displayed on your screen.
- You need a way to hold the processing "still" while you can look around your virtual world (possibly poking and prodding it).
- You need a system to display your physics bodies, if you have a physics engine (or something that acts similar to one).
- You need a system to draw labels for "interesting" things and have those labels "stick" to those things as they move about the world.
- You need a way to draw simple lines for various purposes. This may be a little bit of a challenge because of how the screen gets redrawn, but getting it working is well worth the investment.
These items are not a substitute for your existing logging/debugger system, they are a complement to it. These items are somewhat "generic". You can get a lot of mileage out of simple tools, though, if you know how to use them.


") It's just a law of entropy
It's just a law of entropy
When I made a software renderer, I discovered that having a bug isn't really the problem. Finding it and fixing it were the hard part. Having the game crash with a message like [invalid pixel location(-2, 5)] didn't do anything. I ended up adding visual debugging and tools that would let me inspect the output much like a 3D editor, with a top, left, front, and perspective display, as well as the ability to blow up pixels as large square to check for cracks in adjacent triangle, debug the line drawing algorithm, and just point me in the right direction.
I think this is a good list of features to add to a 2D game sooner rather than later. Nice job.